Exploring user journeys in GA4
By: Anup Saund | July 31, 2023 | GA4 and google analytics
One of the most helpful uses of website analytics for an ecommerce site is being able to track a user’s journey. Following someone’s path as they enter the site, visit different pages, and reach (or don’t reach) key milestones can tell you a lot about what is working on your site and what isn’t.
You want to see where your sales funnel leaks (where people abandon the process or fail to complete purchases), and then explore why that’s happening so you can fix any problems on your end to increase sales. It’s a way to track success, find places where the user experience can be improved, and develop key insights to plan for future projects. We’re going to show you how to get started using GA4-recommended events to build a sales funnel to help you track these metrics for your website.
While the funnel report is one of the standard reports in the GA4 Explore tab, you might need to do some work to ensure the correct events are reported in your dashboard. Some platforms, such as Shopify, automatically send events via their built-in Google Analytics connector; but for sites where we need to send them manually, we need to send GTAG events via code within the web page.
Check out our previous blog post on how to set up custom events in GA4.
GTAG implementation for sales funnel in GA4
The GTAG pixel can be set up as follows (replacing your-stream-id with your own measurement ID):
<!-- Google tag (gtag.js) -->
<script async
src="https://www.googletagmanager.com/gtag/js?id=G-your-stream-id">
</script>
<script>
window.dataLayer = window.dataLayer || [];
function gtag(){dataLayer.push(arguments);}
gtag('js', new Date());
gtag('config', 'G-your-stream-id);
</script>
The most important thing to track from a revenue perspective is when a purchase occurs.
The following code is an example of how to record a purchase.
gtag("event", "purchase", {
transaction_id: "T_12345",
value: 25.42,
tax: 4.90,
shipping: 5.99,
currency: "USD",
coupon: "SUMMER_SALE",
items: [
{
item_id: "SKU_12345",
item_name: "Stan and Friends Tee",
affiliation: "Google Merchandise Store",
coupon: "SUMMER_FUN",
discount: 2.22,
index: 0,
item_brand: "Google",
item_category: "Apparel",
item_category2: "Adult",
item_category3: "Shirts",
item_category4: "Crew",
item_category5: "Short sleeve",
item_list_id: "related_products",
item_list_name: "Related Products",
item_variant: "green",
location_id: "ChIJIQBpAG2ahYAR_6128GcTUEo",
price: 9.99,
quantity: 1
},
{
item_id: "SKU_12346",
item_name: "Google Grey Women's Tee",
affiliation: "Google Merchandise Store",
coupon: "SUMMER_FUN",
discount: 3.33,
index: 1,
item_brand: "Google",
item_category: "Apparel",
item_category2: "Adult",
item_category3: "Shirts",
item_category4: "Crew",
item_category5: "Short sleeve",
item_list_id: "related_products",
item_list_name: "Related Products",
item_variant: "gray",
location_id: "ChIJIQBpAG2ahYAR_6128GcTUEo",
price: 20.99,
promotion_id: "P_12345",
promotion_name: "Summer Sale",
quantity: 1
}]
});
To get the full picture of how users might interact with the site in their purchase journey, we would also want to record events such as check out, add to cart, or view item. These events are available as recommended events in GA4. We also have further granularity for things like remove from cart, or view cart. Capturing those events as well will allow us to see when abandonment happens during the sales funnel.
Viewing and customizing the funnel report in GA4
Now that the tags and events are set up, how do we see the actual funnel?
Head to your GA4 dashboard and select “Explore”. Here you can build custom reports based on different events you’ve implemented. Select “Funnel exploration”. This is going to be the beginning of our user journey report. It’s already set up for most of what you need in a sales funnel; we just want to customize it to our particular needs.
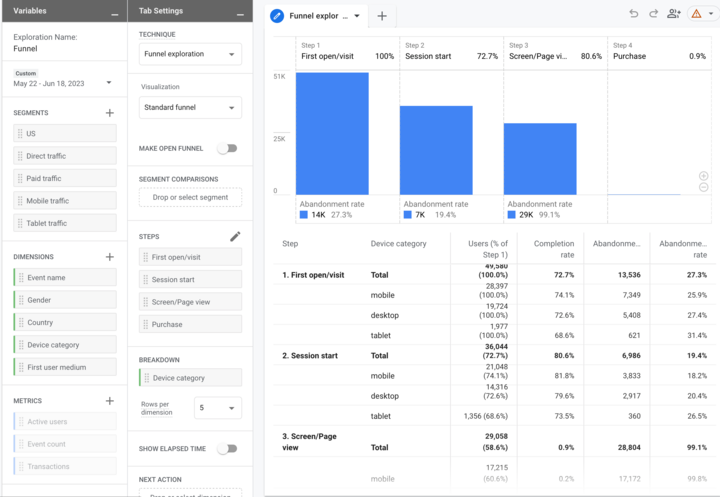
On the left of the table, we have different segments and dimensions to filter our data by. Segments are what portion of our user base we want to see. For instance, if you want to see a segment of the users who live in a specific zip code who have visited the site in the last seven days, that’s an option. If this sounds similar to a GA4 “audience” that’s because that’s what user segments essentially are. You have the option of defining audiences in your GA4 settings (and then selecting the preset audience in the report), or you can create them on the fly here in explorations. By default, this is based on geographic data and the platform used to access the site, but building custom segments inside explorations gives you a bit more flexibility to really zoom in on specific types of users or behavior on your site. In the unlikely case your site meets the threshold for predictive analytics, you’ll also see those options here.

Dimensions are data attributes that we’ll use to break down the steps in the user journey. You could think of them as additional custom filters for the funnel. To add dimensions, click the Plus button beside the category to open the window for additional options and to find the events you want to follow. Specifically for our needs, we want to add those custom events we created as dimensions. For our identified segment (users from zip codes who visited in the last 7 days), we want to see how many made a purchase and then see how that funnel narrows and why.

Now the fun part: you can start playing around with the data to see different user journeys, and you can get as granular as you want with these. You can even set up different funnels in additional tabs of the report.
To fully customize your funnel, click the Edit icon next to steps. This opens up the panel to let you set steps and custom parameters for each stage. You can add additional steps, set time parameters (how long did it take for a user to reach this stage), and target individual pages.

Once you’re satisfied with your step configuration, you can analyze your data. If you see a certain step has a high abandonment rate, then it’s an indication that something in the process has failed. Perhaps more enticement is needed to help the user get across the finish line to the purchase stage. Is there a difference in that stage based on whether the user is on a desktop or mobile device? What about the user experience in that mode could be improved?
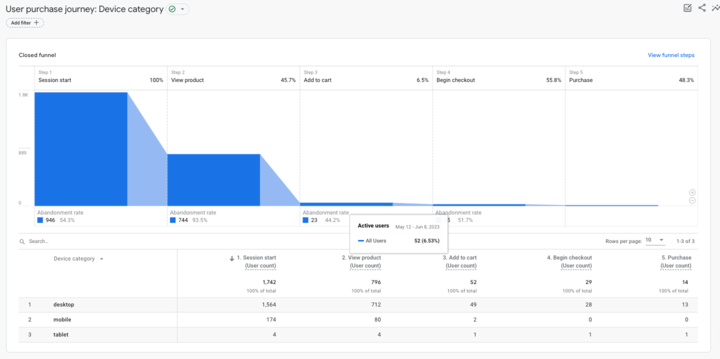
You can see that this is a report that you will want to come back to often. Once created, you can always find this report in your Explore tab, and the drag-and-drop elements allow you to adapt it to different needs as your business changes.