Why A/B testing is an important part of your digital strategy
By: Dave Fearnley | November 14, 2017 | Business solutions and Web solutions
Follow along as we demonstrate a stunning example of the importance of testing changes to your site.
Optimizing the effectiveness of your web content is necessary if content is a key part of your business. It is important to understand how changes you make to the way your content is delivered affect the user’s experience.
While analytics tools provide historical data on content performance, this data cannot be reliably used to predict how the data will change if you make alterations to your site. A/B testing tools, such as Adobe Target, Google Optimize, and Optimizely, allow you to test the impact your changes might have on your site, temporarily presenting changes to part of your audience while still serving your unchanged content to others.
What kind of changes are we talking about?
- Ad placement: Do the ads work better as a header, alongside your content, or within the content itself?
- Size and position of images: Is bigger always better?
- Line spacing, size, and weight of fonts used for regular text and headers: Is your text easy to read?
What metrics are you concerned about improving?
- Ad click-throughs: Are visitors clicking on the ads?
- Time spent viewing the page: Are people actually reading your content?
- Number of pages viewed: How many of your pages are being visited?
- Time spent navigating the website: The total length of visit
- Social media interaction: Is your content being shared?
Define your A/B testing goals
You need to set goals for your tests. For instance, what level of improvement in your metrics will warrant implementing your change? Establish an acceptable timeframe for the test. In some cases, merely making a change to a page will prompt action just because it's new to the viewer. You must allow sufficient time for the data to normalize. You may find that a change initially draws a lot of attention but then loses its lustre after a few weeks.
Although the term A/B testing may imply an either/or scenario, some testing tools allow you to test multiple changes at once, for example testing the image on your article pages at its original size against two or more different sizes.
You can determine whether your goal is met by measuring three metrics:
- Conversion - Measure a specific user action such as clicking an element or viewing a page.
- Revenue - Track revenue per visitor or total sales, etc.
- Engagement - Measure the number of page views per visit or total time on the site.
These metrics can be used individually or mixed and matched to produce complex scenarios and reporting.
Let’s have a look at Adobe Target, and, in the process, review a working example using this powerful tool.
A/B testing tool interface: Adobe Target
Target divides the test into "experiences". By default, Experience A is designated the "control" representing the unmodified state of the site. You'll need to create one or more experiences to test against the control. Although the experiences are named A, B, C, etc., you can use your own custom names.
There are two ways you can modify your content for each experience. You can make changes directly to the DOM via the modifications panel, or you can inject custom JavaScript to manipulate the content.
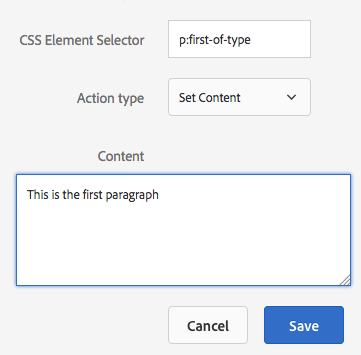
Using the modifications interface is very straightforward. You use CSS selectors to identify the element or elements you wish to alter. Once you have entered the selector, you have two choices.
You can change the content of the selected element(s):
Or you can change any attribute of the element(s). This is a powerful option allowing you to change the appearance through the style attribute. This will override any of the styles initially loaded by the element:
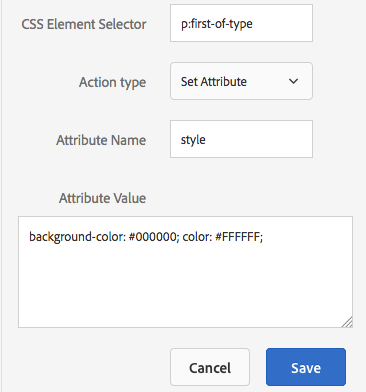
The above will not work with elements added to the DOM after the initial page load by JavaScript, such as the social tools injected by utilities like AddThis and Gigya.
To handle these situations, Target provides the ability to test changes to the content by injecting raw JavaScript or jQuery into a page. Code injection is not just an alternative to the more user-friendly modifications UI. You can do much more with it, such as change the behaviour of a button or an animation. If there is an entirely new feature you want to test, you can add the feature without touching the production code base, avoiding unnecessary code deployments until you are sure what will be most effective.
Once you have your experiences set up, there are two more steps.
First, you need to establish your target audience. There are many pre-loaded defaults and you can even define your own custom audiences. The default audience is simply everyone, but you can limit the audience to a specific browser, mobile or desktop platforms, or from a referral location. In this step you'll determine how to split the audience. It's best to start off serving each test equally:
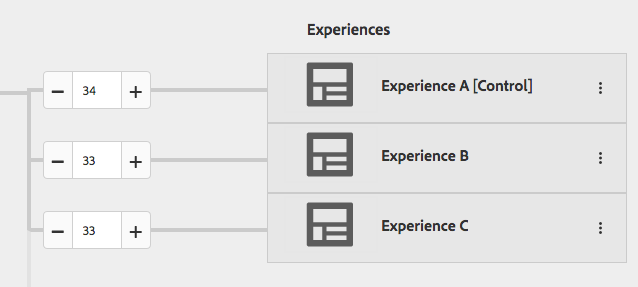
These percentages can be modified while the test is running. Changing the percentages will skew the test, so be sure there is a good reason for adjusting the proportions. For example, let's say you've decided that Experience B has won the test. It may be some time before the winning changes can be permanently added to the production code base. In the meantime, you can keep the test running but send 100% of the traffic to Experience B until the new code is released.
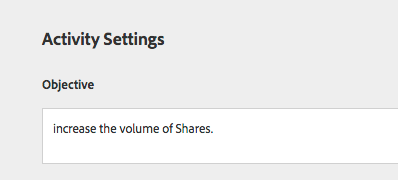
Finally, you need to set up how you are going to track conversion. There is a field where you can indicate your goal. This field does not serve any technical function; it's for information only:
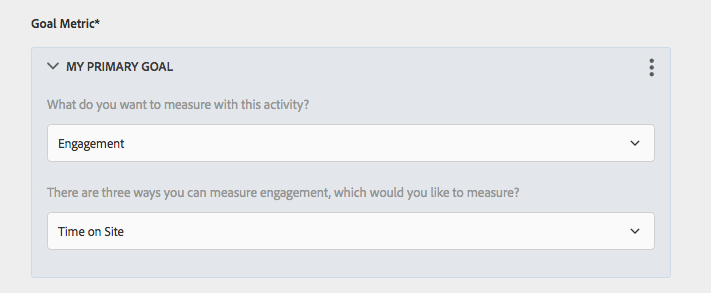
And now you'll need to establish what metric is being measured. Here you can see an engagement metric has been selected to measure how much time visitors spend on the site per visit:
Example test: engagement with social sharing buttons
In this case, the client wanted to experiment with changing the colour of their social sharing buttons from the default blue to either grey or teal. The buttons are added after the document is loaded, and therefore any changes to be tested must be made after the buttons are added to the DOM. This precludes the use of the modifications UI. The code must also account for the variable load order of the A/B test code and the social sharing buttons because both the Target plugin and the social sharing plugin load asynchronously.
The goal of the test is increased social sharing, therefore the measurement will be user clicks on the social buttons. We will record and report on conversions -- clicking on an element.
Below is the code we inject into Experience C to change the colour of the social sharing buttons to teal. No code is needed for Experience A as it is the control. The code injected into Experience B is the same except that the value passed to the updateIconColours function would be grey.
// Here's our function to change the colour of the sharing icons.  The colour parameter will vary test to test.
// Note this function will not be included in the control experience

function updateIconColours( colour ) {
    jQuery( "ul.share-tools > li > i" ).css("color", colour);
}

// Before we can run the above function, we need to test for the existence of the elements.
// Using a timer, we can check the DOM

jQuery( document ).ready( function(){

    // Place the elements we are waiting for in an array.
    var arrSelectors = [ 'ul.share-tools' ];
    setTimeout( function(){ waitForElementToDisplay( arrSelectors, 300 ); }, 500 );
});

// If we have more than one test running that uses this waiting paradigm,
// we'll have to index the function name and calls.
function waitForElementToDisplay( arrSelectors, time )
{
    // set control variable
    var stopWaiting = true;

    // Loop through our array
    for( var i=0; i<arrSelectors.length; i++ )
    {
        // If we can't find one of the elements in the array
        if( document.querySelector( arrSelectors[ i ] ) == null )
        {
            stopWaiting = false;
            break;
        }
    }

    if( stopWaiting )
    {
        // We found the elements - update our colour.
        updateIconColours( '#008996' );
        return;
    }
    else
    {
        // Wait again
        setTimeout( function(){ waitForElementToDisplay( arrSelectors, time ); }, time );
    }
}

# The use of jQuery as opposed to $ is employed due to Target's example code and experiencing more consistent results using this paradigm.
When the test loads, Experience A will display the social sharing buttons in blue:
Experience B displays the buttons in grey:
Experience C displays teal buttons:
Finally, reporting is the most important aspect of any testing tool. Here is a graph of the results of our social icon test:
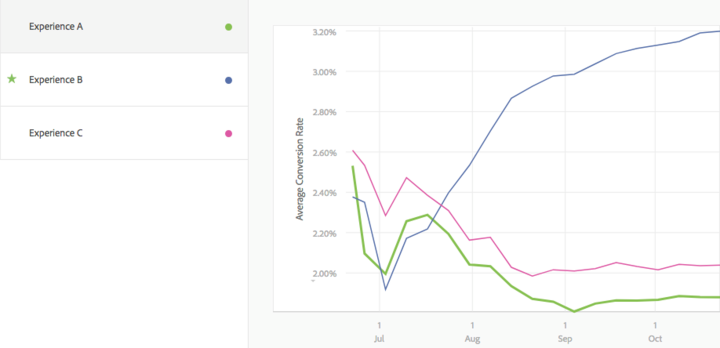
As you can see, these are some pretty clear results, with Experience B resulting in many more social sharing button clicks. Note that the eventual winner was actually showing as the worst candidate for two weeks into the test and was converting visitors at a lower rate than even the control experience. This is why it is recommended that you run tests for at least a month or more. Whatever timeline is initially agreed upon, be prepared to be flexible. As you can see, even after one month the data is still fairly volatile. Once we reach the second and third month of the test, the data becomes more consistent and we can declare a winner.
Target also reports on the confidence level of the results based on certain algorithms. The "confidence level" is a measure of the statistical significance of the results. In other words, how dependable and repeatable are the results? According to the Target help documentation:
A higher confidence level indicates:
- The experience is performing significantly differently from control
- The experience performance is not just due to noise
- If you ran this test again, it is likely that you would see the same results
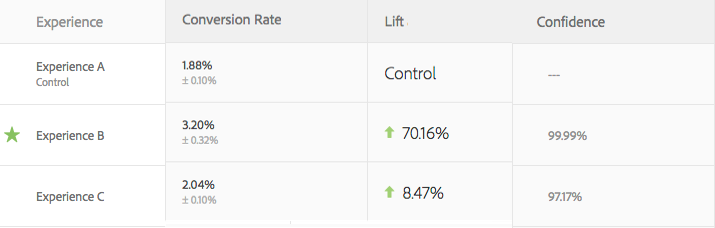
A successful test should display a confidence score of 90% or more. We can see in this view that Target has assigned a confidence level of 99.99% and has picked Experience B as the suggested winner according to its algorithms:
The winner of this test shines a light on the very reason it's important to test changes in the real world. You might be surprised that the winning colour was grey, not the default bright blue or the more eye-catching teal. The assumption could very likely have been made that a brighter colour would enhance interaction with the social icons. We can now report that grey wins the day, at least in this case!