Rasmussen Reports is a content-rich information hub, with millions of page views each month.
Rasmussen Reports, an opinion polling publication that focuses on politics and public policy, knew that the 2020 U.S. presidential election would mean an enormous influx of traffic to its site. But the site’s design was outdated – it was not fully optimized for mobile users, and its paywall and CTAs weren’t doing a great job of converting guests into paid subscribers. Rasmussen turned to its longtime development partner Mugo Web for creative solutions, based on Ibexa’s eZ Platform DXP.
"I would trust Mugo with the life of my company. They know the business and technology so well. They understood the project goals and were able to execute and turn ideas into results."
Beth Chunn, General Manager, Rasmussen Reports
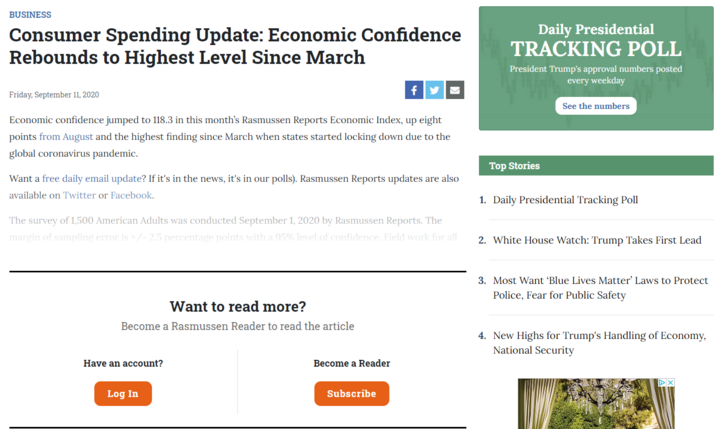
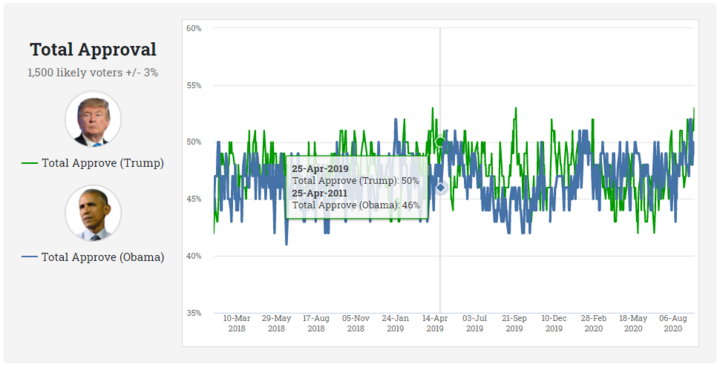
Rasmussen Reports, a political and public policy opinion polling organization, needed to update its site to take full advantage of the increased reader interest that it knew was coming with the 2020 U.S presidential election. Rasmussen’s main site, RasmussenReports.com, is now the only source for a daily approval / disapproval rating for the U.S. president.
But Rasmussen’s website had not kept pace with its position as a leader in public opinion polling. The site was not fully responsive, and so could not support various multi-channel revenue opportunities, including programmatic video sponsorships. The site also needed to get better at converting guest traffic into paid subscriptions, a key revenue source for Rasmussen’s data-driven model.
So general manager Beth Chunn turned to her development partner, Mugo Web, for a substantial site refresh and relaunch in July 2020. Rasmussen has worked with Mugo Web for about 12 years, even before Chunn joined the organization, so Mugo had a deep understanding of the business’ goals.
“I would trust Mugo with the life of my company,” Chunn said. “They’ve never been the type of people to say, ‘No we can’t do that’ – they figure out how to make it happen.”
Sometimes, the most important aspects of a site redesign are subtle UX tweaks that just make things a little more clear to users.
“We focused on making the user experience straightforward and enjoyable across devices and screen sizes,” said Peter Keung, Managing Director at Mugo Web.
In addition to making the Rasmussen site fully responsive – previously, device detection routed users to either a desktop or mobile version – the Mugo team improved the display of CTA elements that encourage users to subscribe for full access to site content. A simple visual change to the paywall CTA to include a “fade out” effect made it clear to readers that there was more content available.
“The simplest changes can have the most impact,” explained Keung. “Sometimes we need to be splashy and bold to draw your attention, but in other cases we just need a simple tweak.”
And the tweaks certainly have made a difference. Chunn said that since the re-launch, subscriptions to pay-level access to article content have increased as much as 400 percent.
Article content is flagged by default as being subscriber-only in the Ibexa DXP. Site managers simply have to flag it as being fully available to guests to create a healthy content mix that keeps public interest high while encouraging audience monetization via both monthly and annual subscriptions.
Another revenue growth area has been in “platinum”-level subscriptions, which offer Rasmussen subscribers a deeper look into the demographics behind polling results. Platinum subscribers have access to cross-tabulated breakouts of poll results by age, party, gender and race, and can also download results as a spreadsheet for further analysis.
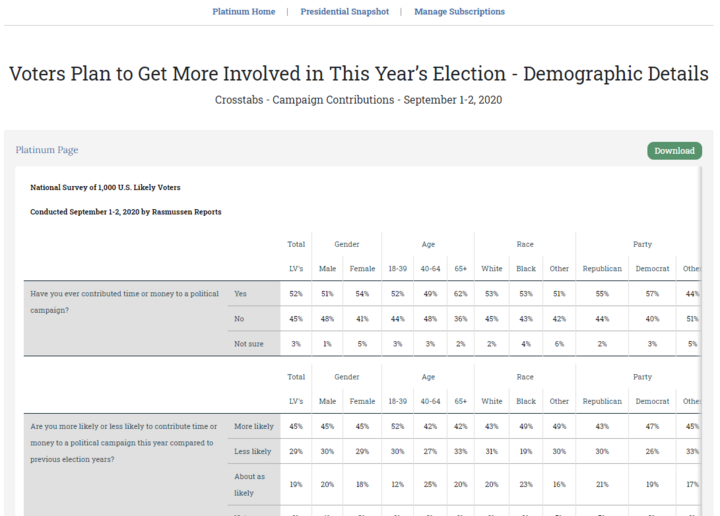
Platinum subscriptions have also increased dramatically since the redesign, Chunn said. While some of the growth can be attributed to the expected increase of interest around the presidential election, she added that better promotion of the service has also played a key part.
“I think before, people just didn’t know there was more to the story,” she said.
As anyone in publishing will tell you, a key to converting guest readers to subscribers is a seamless payment system.
Rasmussen’s payment and online fulfillment is handled entirely on its own site via a custom solution built by Mugo Web on top of the Payflow Pro (by PayPal) gateway. The system handles renewals, auto-renews, expiration notices, and upsells – the user never leaves the Rasmussen site experience. And all subscription entitlements are stored within the DXP.
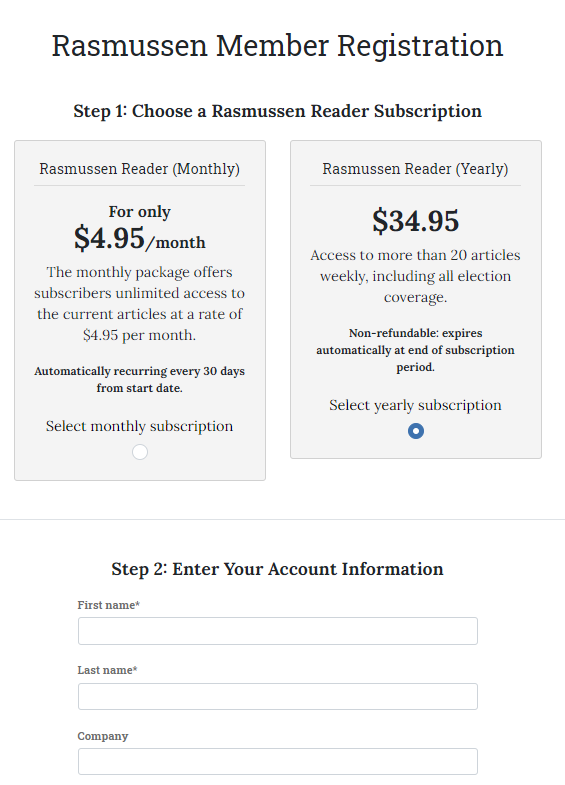
“While the behind the scenes work might be complex, the checkout experience the users see should be seamless,” Mugo’s Keung said. “Staying under a site’s brand for payment gives users confidence and lets them quickly get access to the content they came for.”
Mugo Web has built several other key integrations between the Ibexa DXP and niche systems that support Rasmussen’s distinct needs as a polling service.
Overall, the site redesign has been a hit with readers, Chunn said, with engagement stats to prove it.
Since the site relaunch, time on the site per session has increased by about 50 percent, all during a time when a lot of new or infrequent users are coming to the site. (As interest in the presidential election increased, site traffic effectively doubled in August 2020.) Page views have also increased to more than 2 per session, a healthy metric for a news site that gets a lot of its traffic from organic and social media references. (Rasmussen has 70,000 Facebook followers and 330,000 Twitter followers.)
The site’s bounce rate is also down by 16 percent compared to prior to the re-launch. And mobile usage has gone up 6 percent (now outpacing desktop) since the shift to a fully responsive design.
Mugo’s Keung said that the redesign did not include any dramatic changes to the navigation or content structure; long-time users will have no trouble finding content in the new site.
“Subtle changes can make a big difference in making the website welcoming, and that causes visitors to stay on the site,” he said.
As traffic grows, so does the need to ensure that the site is always up and performing to create a positive user experience.
This is a particular challenge in the case of RasmusenReports.com, since so much of its traffic comes in spikes. There’s an expected lift in traffic each morning when the daily presidential approval poll is released, but the site also experiences traffic spikes of 50x or more when Rasmussen’s findings are cited by other media.
In fact, Mugo’s Keung said his firm first began working with Rasmussen during the 2008 presidential campaign, when they were called in when bursts of traffic would routinely bring down the site.
Mugo is expert at managing resource usage in the Ibexa DXP environment, Keung said, and since it’s taken over management of the Rasmussen site, there have been no uptime issues. ‘We know when and where to clear content and refresh certain caches.” he said. Mugo also employs the Varnish HTTP reverse proxy layer as a key component of its stack and hosting environment.
Throughout the Rasmussen Reports site relaunch project, Mugo acted as both business analyst and development partner, defining detailed requirements based on high-level needs expressed by Chunn and her team.
The Mugo development process includes iterative check-ins with the client and full transparency into the project’s progress, Keung said, allowing for the site redesign to move ahead quickly without a lot of cumbersome overhead.
“They know the business and technology so well. They understood the project goals and were able to execute and turn ideas into results,” Chunn said.

Managing bot access to your website is one of the least sexy tasks a site manager handles. You just identify the bot’s user agent, edit robots.txt to allow or disallow access, and you’re done. Right?
Of course, nothing’s ever quite that simple when it comes to safeguarding your web identity. Sure, robots.txt is still the industry stalwart – it’s a tactic we often use for our clients here at Mugo Web when we want to block a specific bot for some practical reason.

Mugo partner since 2023
East Gwillimbury Public Library launches new website and sees immediate increase in use of library services

With Gmail and Yahoo now requiring bulk emailers to implement authentication protocols, making sure you understand the differences between SPF, DKIM, and DMARC and how they work together is essential for your email marketing efforts. We'll walk you through how to set these up in your email provider of choice.

While YouTube embed options are powerful and effective, they are not always the most efficient use of resources when it comes to bandwidth. Using a facade can help decrease page load time and increase site performance without sacrificing any of the utility of the native YouTube embed options.

Generative AI is shaking up every category of knowledge work, and professional software development is on the front lines of the revolution. With new advancements on the horizon, what does that mean for developers in the here and now? Our team experimented with a few of the leading tools and shared their impressions, along with suggestions on best practices for navigating AI usage in web development.
Typing the same instructions into multiple terminals at the same time is a great trick when you have a group of servers that have the same or similar configurations.

WordPress has a flexible and robust ecosystem for creating a wide variety of websites. But when your site needs to grow and expand functionality, having a dedicated, experienced development team to support and build out new features is essential. Learn about Mugo Web’s best practices when it comes to developing in a WordPress environment and see how we’ve helped save clients thousands of dollars with innovative solutions.

Mugo Partner since 2023
Collingwood Public Library’s new website triples site visits and dramatically improves patron usability
Mugo Web
Unit 205, 332 Columbia Street
New Westminster, BC
V3L 1A6, Canada
Phone: 604-637-6396
E-mail: hi@mugo.ca